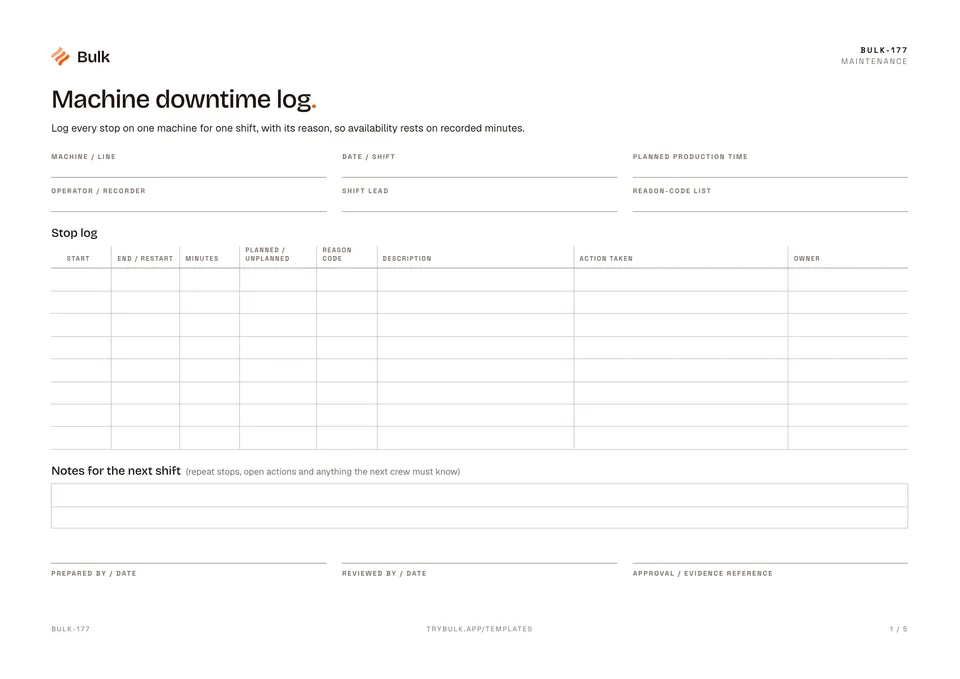
 Machine downtime logLog every stop on one machine for one shift, with its reason, so availability rests on recorded minutes.
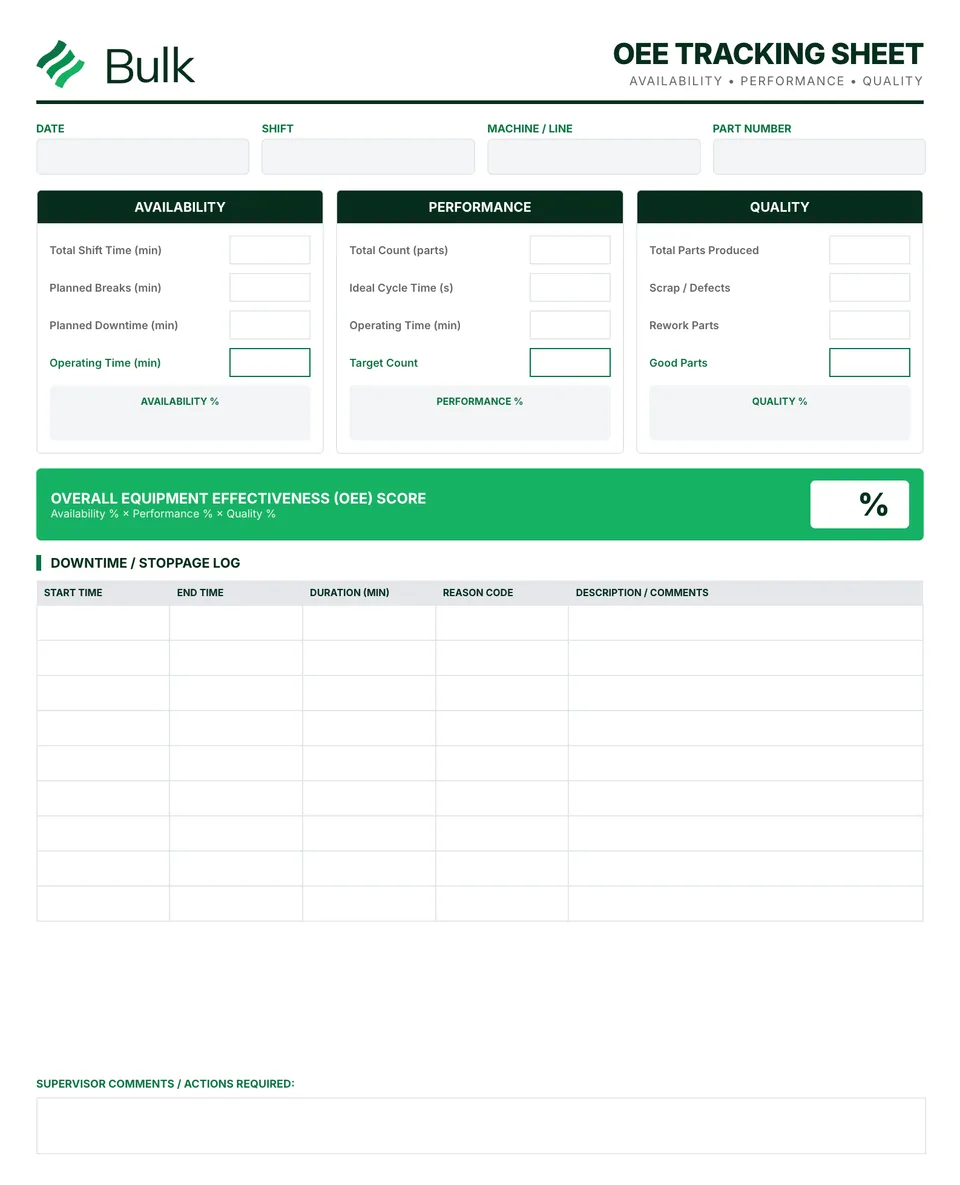
OEE Tracking Sheet (Overall Equipment Effectiveness)
Define the production window and planned exclusions before collecting data.
What it's for
Use this OEE tracking sheet (overall equipment effectiveness) to keep the working record, its evidence and follow-up together. Define the production window and planned exclusions before collecting data. Use minutes for durations, seconds per piece for ideal cycle time and consistent total/good counts.
Recording individual stops
This sheet totals losses for the period. To see which stops drive availability loss, record each one with its start, end, duration and reason on a machine downtime log, then carry the total minutes into the availability calculation here. Rank repeat reasons on a Pareto chart, and check your availability, performance, quality and overall OEE figures with the free OEE calculator.
What you can download
The PDF contains the original blank form pages, followed by a completed fictional example and a separate instructions page. Print only the blank pages for use at work; keep the example and guide as references. The download is free; enter your email to receive a secure link valid for seven days. Product-news consent is optional.
Completed manufacturing example
A 450-minute planned production period contains 50 minutes of availability loss. At a 30-second ideal cycle, 720 total pieces and 700 first-pass good pieces give OEE of 77.78%.
Availability = 400/450 = 88.89%; performance = 720/800 = 90%; quality = 700/720 = 97.22%. OEE = 700 x 30 / (450 x 60) = 77.78%. The target gap is -2.22 percentage points.
When to use this template
Keep setup loss inside the agreed production window; do not remove losses just to raise OEE. Zero denominators mean no valid result. First-pass rejects include rework and must not be subtracted twice.
Reference guidance: Vorne: calculating OEE.
Use the OEE calculator to check availability, performance, quality and overall OEE before transferring the results to your record.
Continue with Daily Production Log, Machine downtime log, Pareto chart, Time-study worksheet.
For shared records, evidence and follow-up, explore Bulk OEE analytics. Start a free trial to run it live, no card needed.
How to use it
- Define the production window and planned exclusions before collecting data. Use minutes for durations, seconds per piece for ideal cycle time and consistent total/good counts.
- Calculate availability as operating/planned time, performance as ideal time for total output/operating time, and quality as first-pass good/total pieces. Multiply the decimal factors and convert to percent.
- Reconcile stoppages and equivalent losses without counting the same loss twice. Compare like-for-like periods and assign actions against the measured loss, not an assumed universal target.
Key features
- Availability calculation (actual runtime vs. planned production)
- Performance measurement (actual vs. ideal cycle time)
- Quality factor (good parts vs. total parts produced)
- Overall OEE calculation and trend tracking
- Six big losses categorization and analysis
- Shift-by-shift comparison and benchmarking
- Completed fictional example and instructions
Ideal for
- Production managers measuring equipment effectiveness
- TPM coordinators tracking productivity improvement
- Lean teams eliminating production waste
Common uses
- Calculating one shift's OEE
- Recording stoppages and equivalent losses
- Comparing like-for-like production periods
Questions, answered.
01
How do you calculate OEE?
OEE is availability multiplied by performance multiplied by quality. Availability is operating time divided by planned production time, performance is ideal cycle time times total count divided by operating time, and quality is good count divided by total count. The worked example gives 88.89% x 90% x 97.22% = 77.78%.
02
What is a good OEE score?
85% is commonly cited as world-class OEE for discrete manufacturing, but it is a benchmark, not a rule, and many plants measure well below it when they start. Compare each line with its own baseline using the same definitions, and work on the largest measured loss first.
03
What is the difference between OEE and downtime tracking?
Downtime tracking records each stop, its duration and its reason. OEE combines those availability losses with speed and quality losses in one percentage, so a machine downtime log feeds the availability part of this sheet.
Related templates.
Machine downtime logLog every stop on one machine for one shift, with its reason, so availability rests on recorded minutes.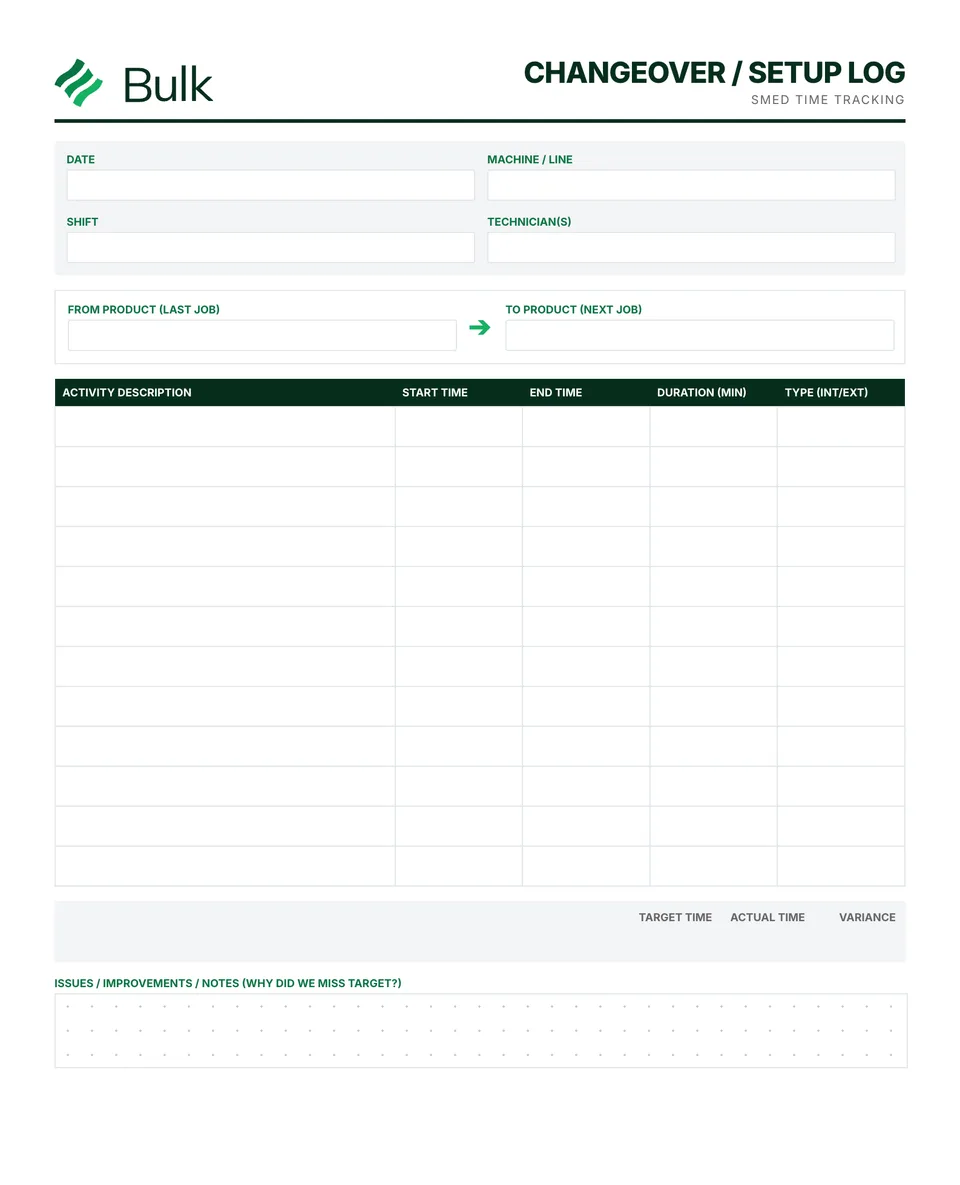 Equipment Changeover LogAgree the start and end definition, products, team and target.
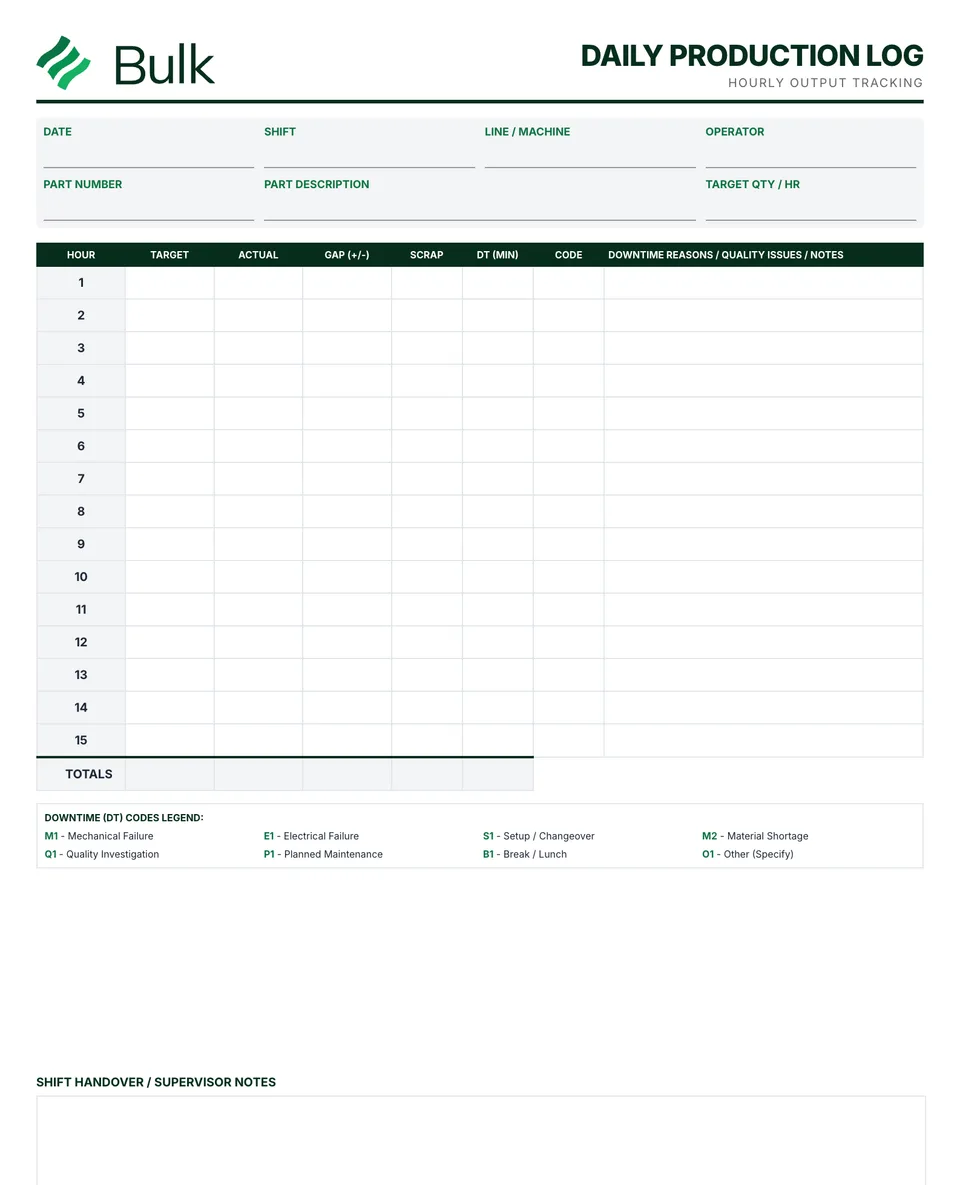 Production Log TemplateIdentify the shift, product, crew and reporting window before recording output.
Turn the form into a live workflow.
Bulk connects the same checks, evidence, owners and approvals to the work happening on your floor.