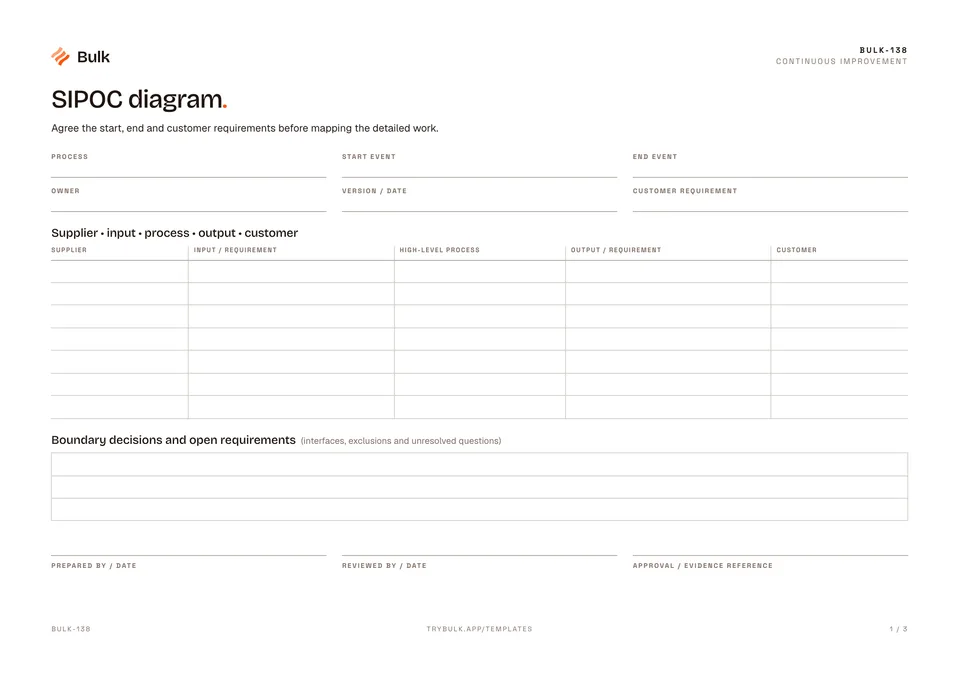
 SIPOC diagramAgree the start, end and customer requirements before mapping the detailed work.
Value Stream Map Template
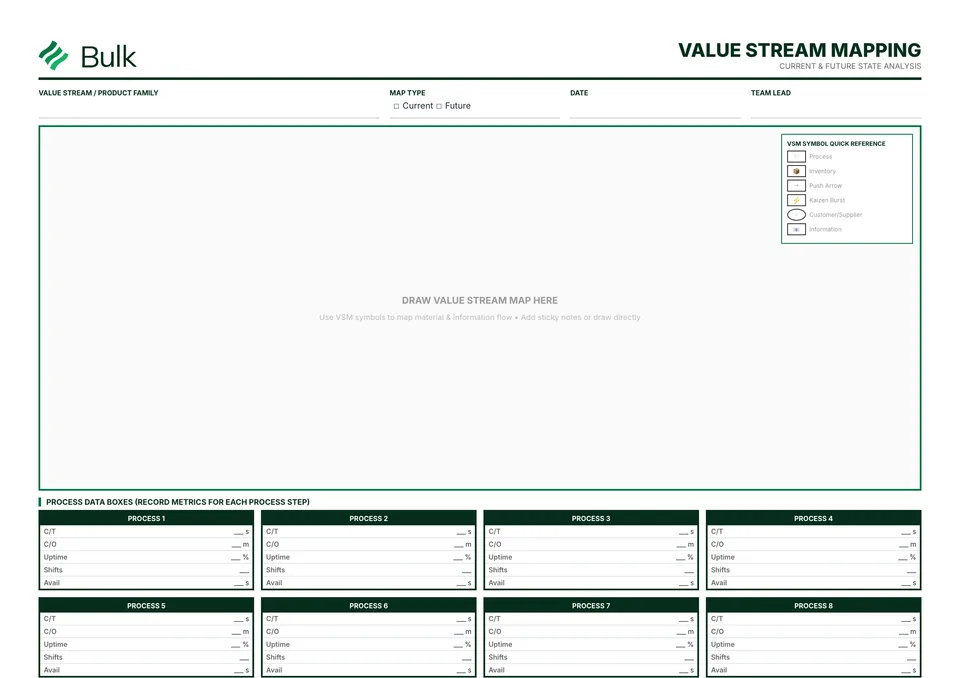
Choose one product family and a current or future state.
What it's for
Use this value stream map template to keep the working record, its evidence and follow-up together. Choose one product family and a current or future state. Walk the flow and record demand, available time, process data and inventory using consistent units.
What you can download
The PDF contains the original blank form, followed by a completed fictional example and a separate instructions page. Print only the blank pages for use at work; keep the example and guide as references. The download is free; enter your email to receive a secure link valid for seven days. Product-news consent is optional.
Completed manufacturing example
A three-process bracket flow has 800 units waiting at demand of 400 per day. Processing takes 80 seconds while the inventory represents two production days of waiting.
Takt = 24,000 / 400 = 60 s/unit. Inventory waiting = 800 / 400 = 2 production days. At 24,000 s/day, lead time including 80 s processing is 48,080 s; PCE = 80 / 48,080 = 0.166%.
When to use this template
The example uses a production-time basis, not 24-hour calendar days. Do not add inventory units to time or treat proposed future-state savings as measured results.
Reference guidance: Lean Enterprise Institute: value-stream mapping.
Continue with SIPOC diagram, Spaghetti diagram, Time-study worksheet.
For shared records, evidence and follow-up, explore Bulk production. Start a free trial to run it live, no card needed.
How to use it
- Choose one product family and a current or future state. Walk the flow and record demand, available time, process data and inventory using consistent units.
- Draw material and information flows, identify process steps and link each data column to its process box. Separate observed current conditions from proposed future changes.
- Calculate waiting and processing on a consistent time basis, identify the constraint and choose a focused improvement. Verify any proposed future-state values before treating them as achieved.
Key features
- Standard VSM icons for processes, inventory, transportation
- Cycle time, changeover time, and uptime documentation
- Inventory levels and lead time calculations
- Information flow mapping (MRP, schedules, forecasts)
- Timeline showing value-added vs. non-value-added time
- Kaizen burst markers for improvement opportunities
- Completed fictional example and instructions
Ideal for
- Lean facilitators leading process improvement projects
- Operations managers eliminating waste and reducing lead time
- Cross-functional teams analyzing end-to-end process flow
- Supply chain professionals optimizing material flow
Common uses
- Mapping one product family's current flow
- Comparing waiting and processing time
- Planning a future-state improvement
Related templates.
SIPOC diagramAgree the start, end and customer requirements before mapping the detailed work.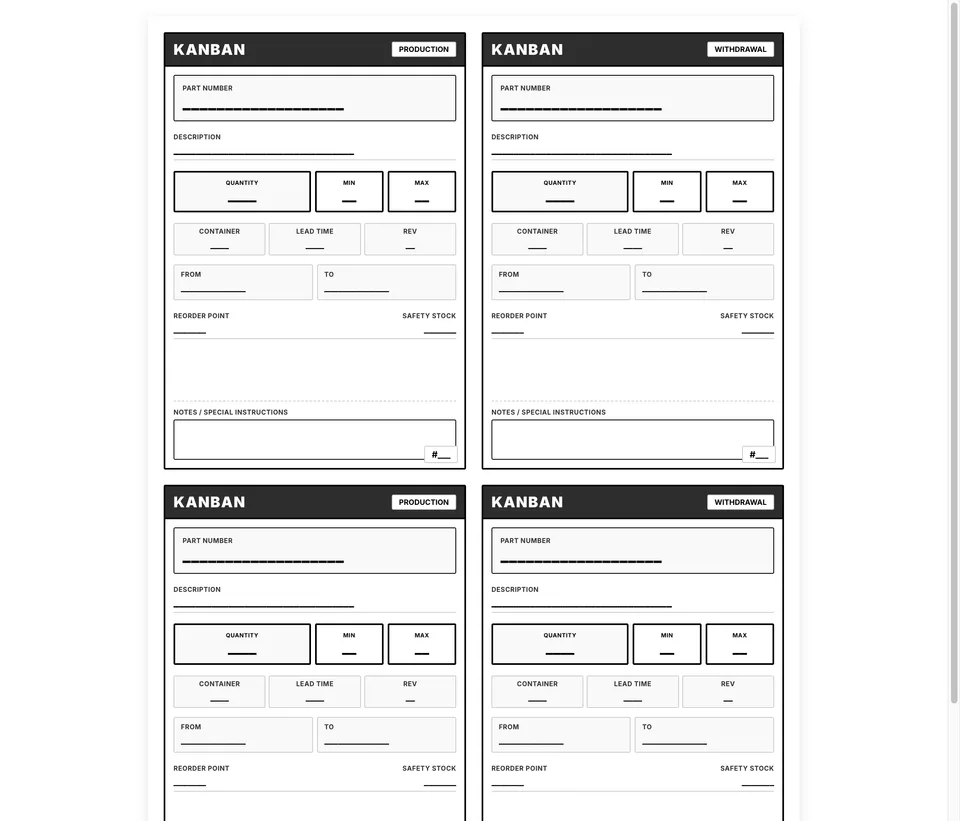 Kanban Card TemplateChoose the part, revision, supplying point, consuming point and standard container.
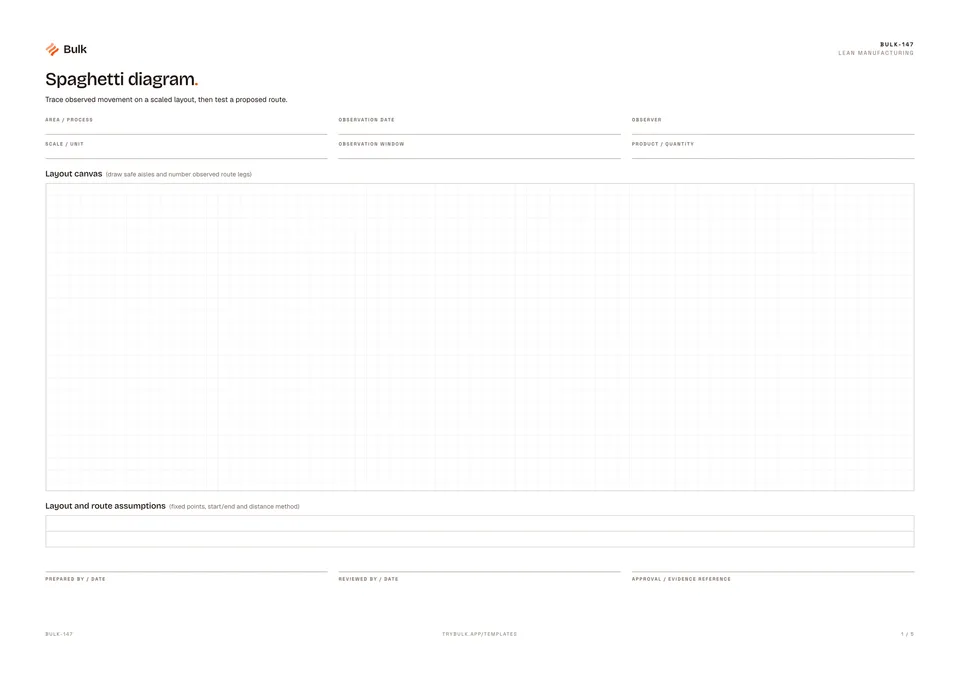 Spaghetti diagramTrace observed movement on a scaled layout, then test a proposed route.
Turn the form into a live workflow.
Bulk connects the same checks, evidence, owners and approvals to the work happening on your floor.