All your plants. One screen. Right now.
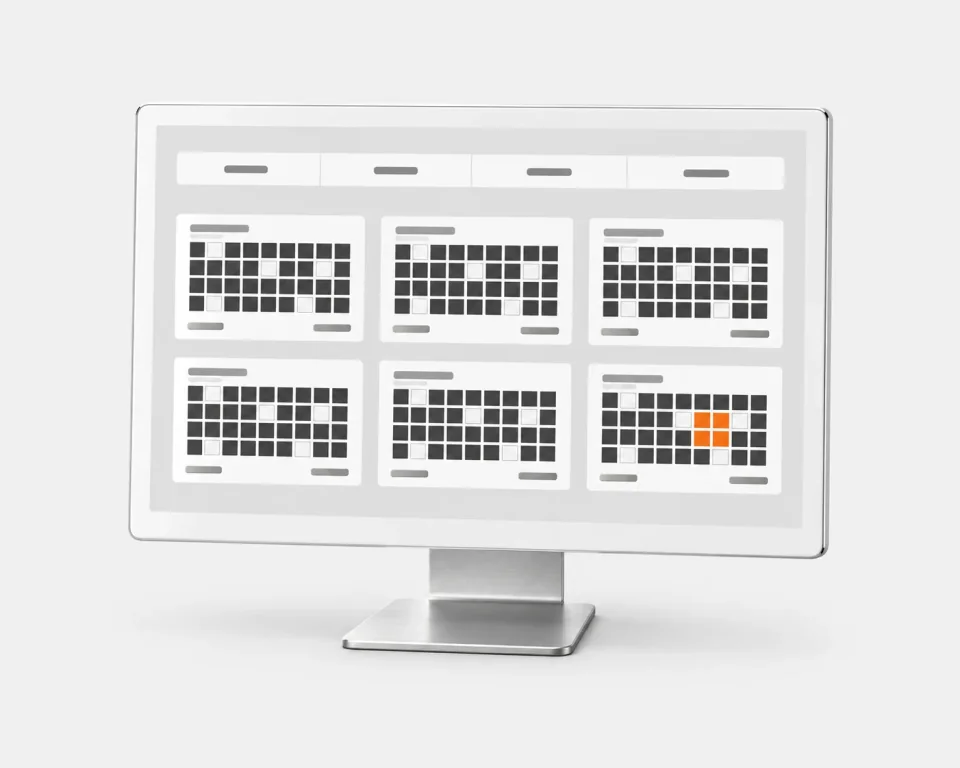
Stop waiting for the weekly pack to know how the group is doing. Each plant shows what is running now and its OEE for the last 12 hours. Click one to step in.
Your Monday, before and after.
A week of spreadsheets
The sheets are three weeks old, and they disagree. Getting them to one number takes one person the whole week.

Choose a plant.
- Assets
- 52
- OEE
- 81%
- People
- 138
- Osaka
Asia/TokyoOEE 88%People 42 - Springfield
America/ChicagoOEE 84%People 38 - Dortmund
Europe/BerlinOEE 79%People 31 - Monterrey
America/MonterreyOEE 68%People 27
One group number
The meeting opens on where each plant stands now, with group OEE for the last 12 hours. Nobody builds a pack the night before.
What changes for you.
See a plant slipping today, not at the quarterly review

Every plant on one measure, the group weighted by recorded machine time
Meetings open on where each plant stands, with nothing to assemble
Your plants are all different? Good. Keep them that way.
Each site keeps its own lines, boards and way of working. The group still gets one number. Site access is set per person, and their role is the same at every site.
Questions, answered.
What is Bulk Multi-site Roll-up?
It puts every plant you can access on one screen, with what is running right now. Group OEE covers the last 12 hours and is weighted by recorded machine time. Atlas, our cross-site report in beta, adds more measures per site, such as quality issues open at each day’s close, coloured against targets you set.
How do I find what is behind a bad number?
Each plant tile shows its machines as running, paused or idle, so you can see which plant to look at first. Click the tile to step into that plant. In Atlas, clicking a plant’s OEE shows the downtime behind it by reason. No phone calls and no “let me check and get back to you.”
How is the group number calculated across sites?
Every site uses the same formula: running time over recorded running and downtime. A pause counts as downtime on asset types with OEE downtime tracking switched on, so set that the same way at each site. The group figure adds the time up across plants before dividing. So it is weighted by recorded machine time, not a plain average of the sites.
Do all our plants have to work the same way?
No. Each site keeps its own lines, boards and way of working. The group still gets one number. You keep the plants different and still compare them on the same measure.
How should we roll Bulk out across several plants?
Start with one representative plant, prove one end-to-end workflow, then repeat the pattern at the next site. Roles are shared across the company, and each site sets up its own lines. Our multi-site rollout guide explains the phased sequence and the decisions to keep shared versus local.
How current are the numbers?
A plant’s tile changes when an operator starts, pauses or stops work. Each time work is recorded, OEE is worked out again over the 12 hours up to that moment. So a plant going sideways shows up the day it starts, not at the quarterly review. Atlas counts whole days up to yesterday’s close, so today’s work shows there tomorrow.
Can we control who sees what across sites?
Yes. Each person is given access to specific sites, and their role is the same at every site they reach. Other plants show as locked tiles with no numbers. Group totals only count the sites a person can access.
See your own plants on it.
Start a free trial, add two of your sites and see both on one screen. No card needed.