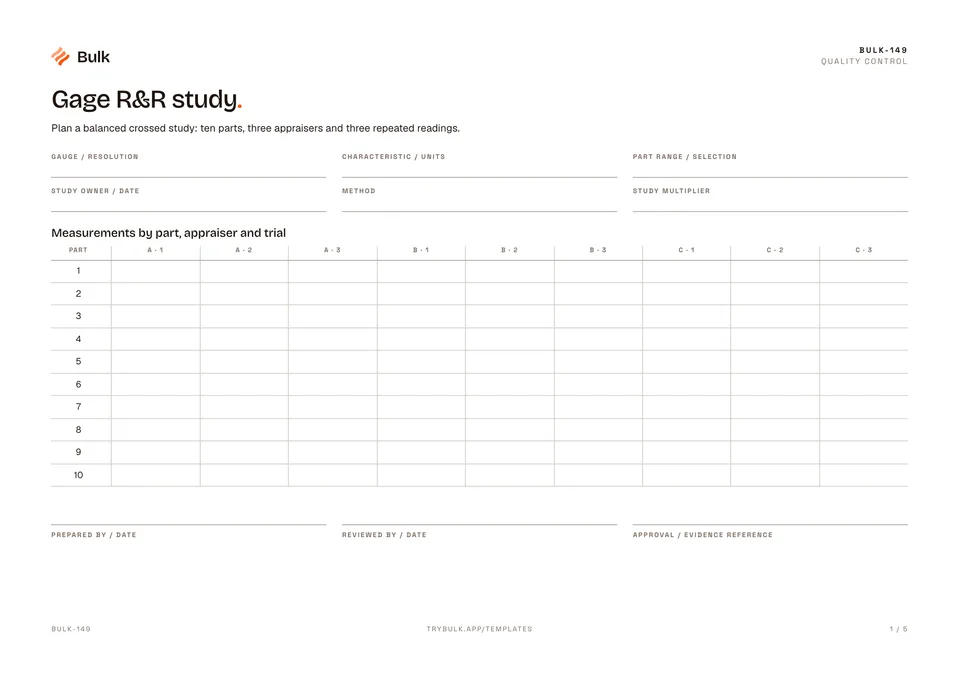
 Gage R&R studyPlan a balanced crossed study: ten parts, three appraisers and three repeated readings.
Individuals control chart
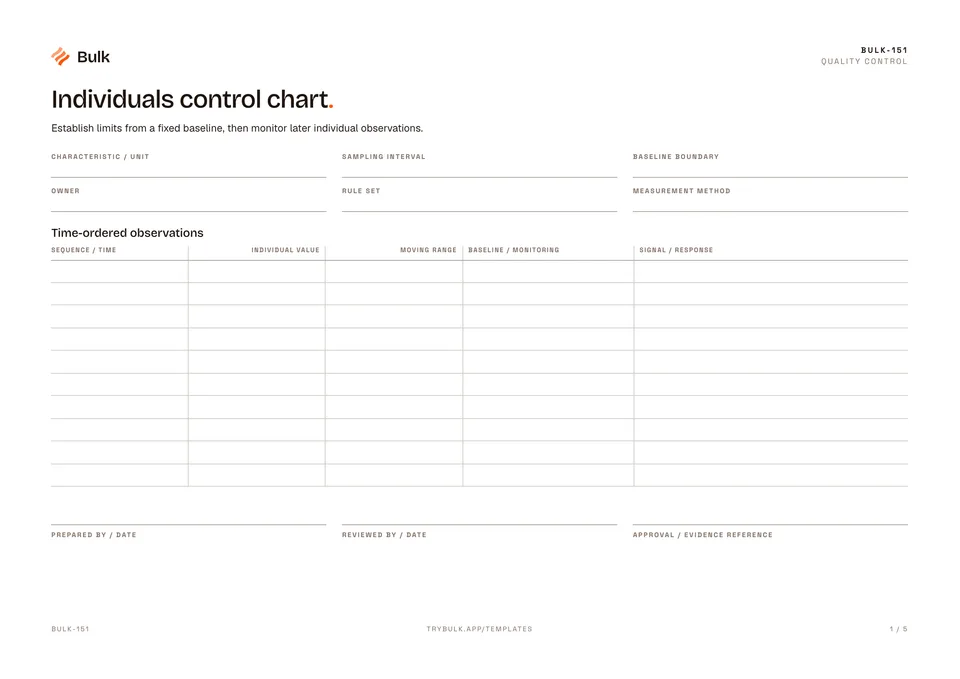
Establish limits from a fixed baseline, then monitor later individual observations.
What it's for
Establish limits from a fixed baseline, then monitor later individual observations.
What you can download
Available files: PDF, Excel. Each PDF includes the blank form first, a fictional completed example and instructions. The Excel workbook includes an unused template and a separate completed example, with labelled inputs, calculation cells and print settings. The download is free; enter your email to receive a secure link valid for seven days. Product-news consent is optional.
Completed manufacturing example
The ten-point baseline has a mean of 50.81 and mean moving range of 1.8777778. Sigma is estimated as mean moving range / 1.128. A subsequent reading of 60 lies above the Individuals chart upper control limit.
The workbook freezes the baseline and checks points beyond an I limit, moving ranges above the MR upper limit and eight monitoring points strictly on one side of the mean. Gaps break runs. Control limits describe process behaviour; they are not specification limits.
When to use this template
For individual continuous readings with suitable independence and distribution. Control limits are not specification limits. This is not a general chart selector or capability study.
I limits use mean ± 3 × (mean moving range / 1.128). The moving-range limits are 0 and 3.267 × mean moving range. The ten-point example is for learning; choose an adequate stable operational baseline with statistical review.
Continue with Gage R&R study, Process control plan, Pareto chart.
For shared records, evidence and follow-up, explore Bulk quality. Start a free trial to run it live, no card needed.
How to use it
- Enter ten consecutive numeric baseline values in time order. Ten is a teaching-sized baseline; agree an adequate stable baseline for operational use with a statistician.
- Freeze the baseline inputs before monitoring. Moving range uses adjacent readings only; a gap breaks the range and the eight-point run.
- Signals are strictly beyond an I limit, strictly above the MR upper limit, or eight consecutive monitoring values strictly on one side of the baseline mean. Points on the mean break a run. Constant baseline variation produces no usable limits.
Key features
- Time-ordered observations
- Fixed-baseline limits
- Signal and investigation record
- Baseline changes
Ideal for
- Quality and process engineers investigating special-cause signals
Common uses
- Monitoring time-ordered individual measurements against a reviewed fixed baseline
Related templates.
Gage R&R studyPlan a balanced crossed study: ten parts, three appraisers and three repeated readings.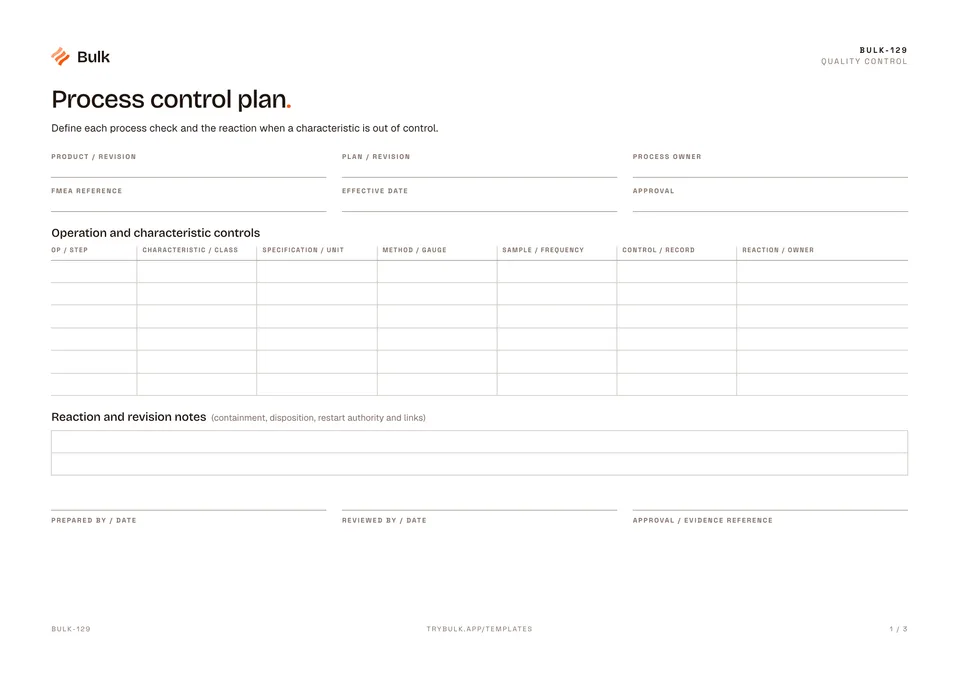 Process control planDefine each process check and the reaction when a characteristic is out of control.
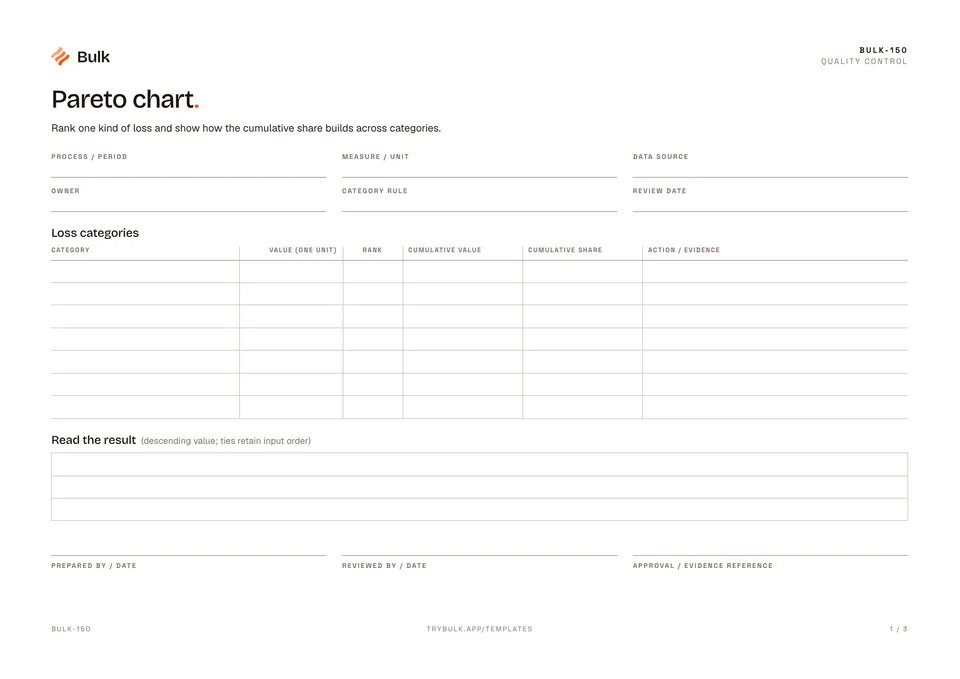 Pareto chartRank one kind of loss and show how the cumulative share builds across categories.
Turn the form into a live workflow.
Bulk connects the same checks, evidence, owners and approvals to the work happening on your floor.