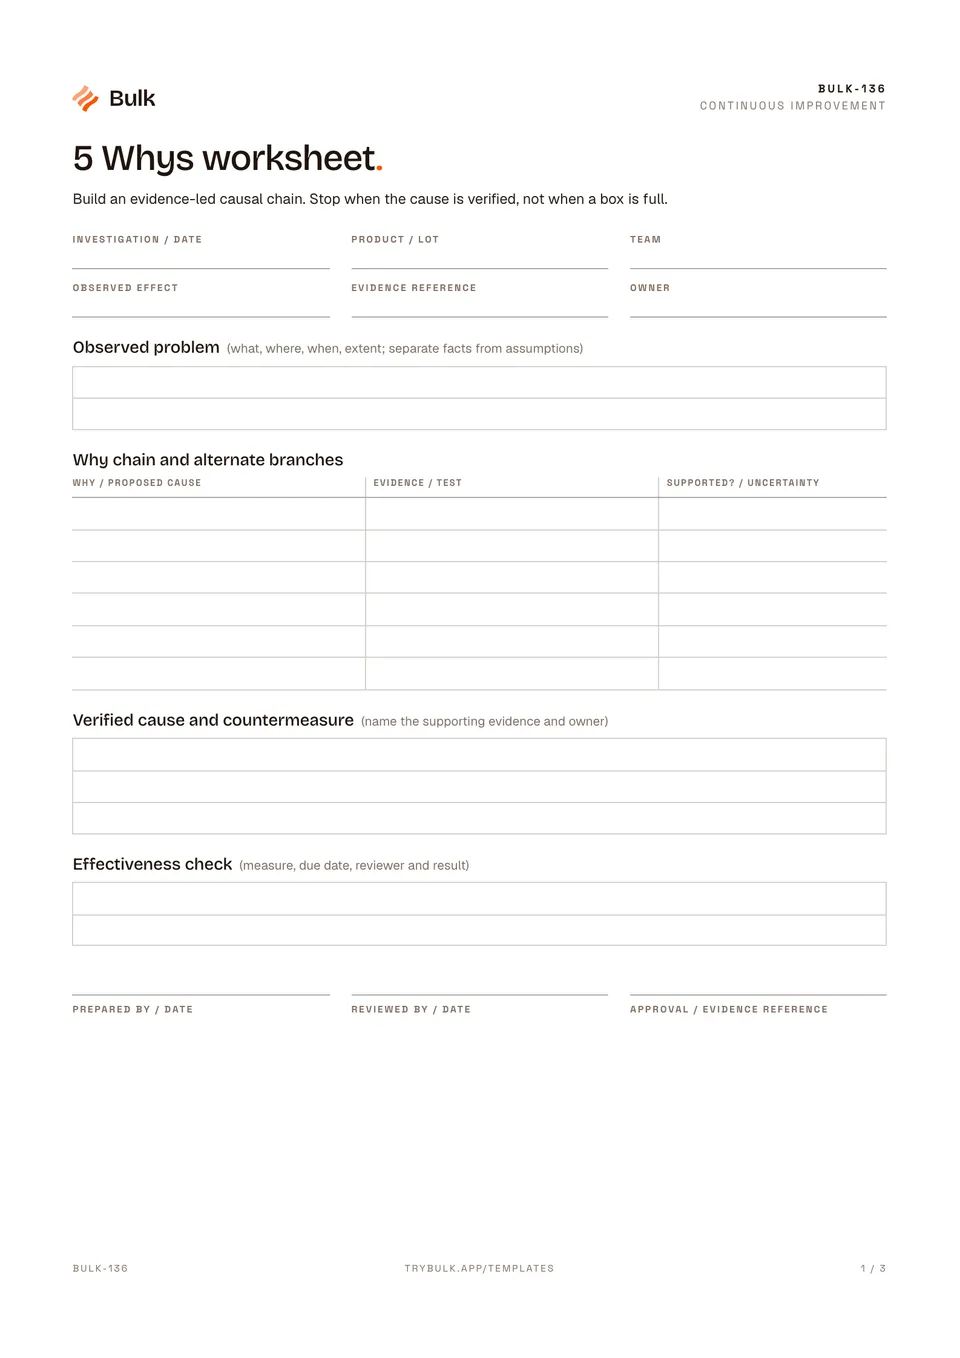
 5 Whys worksheetBuild an evidence-led causal chain. Stop when the cause is verified, not when a box is full.
Fishbone diagram
Map possible causes around one defined effect, then test the hypotheses separately.
What it's for
Map possible causes around one defined effect, then test the hypotheses separately. This fishbone diagram template, also known as an Ishikawa diagram template or cause-and-effect diagram template, gives a team one A3 canvas for the brainstorm and a separate register that records how each idea was tested.
What you can download
Available files: PDF. Each PDF includes the blank form first, a fictional completed example and instructions. The download is free; enter your email to receive a secure link valid for seven days. Product-news consent is optional.
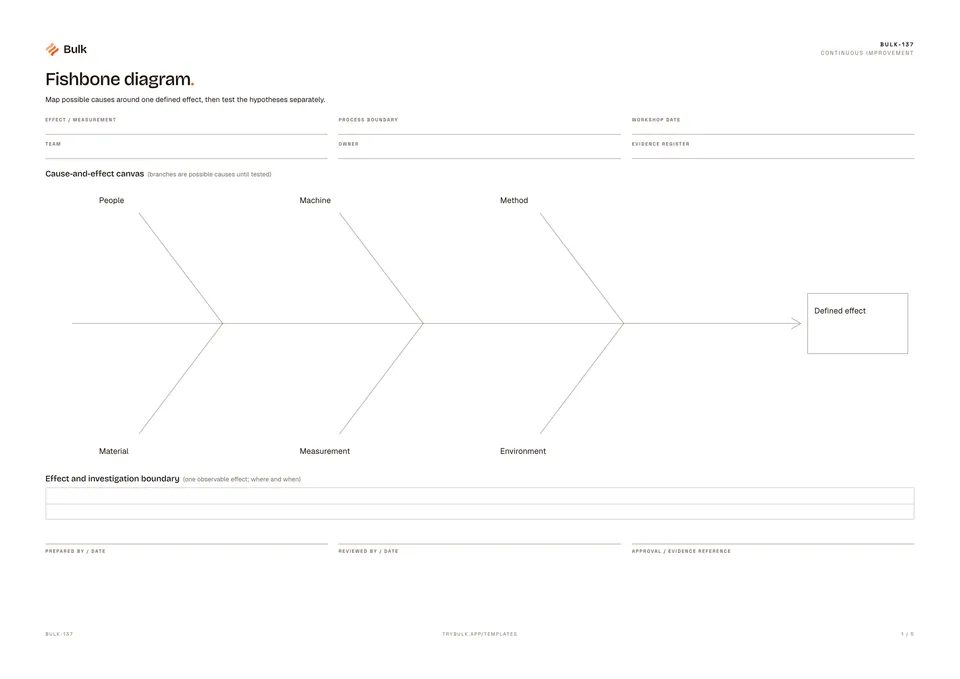
The blank pack has two landscape sheets. The A3 canvas carries the effect and its measurement, the process boundary, the workshop date, team, owner and evidence register reference, then six labelled branches (People, Machine, Method, Material, Measurement and Environment) running into a defined effect box, with a strip underneath for the investigation boundary. The second, A4 sheet is the hypothesis verification register: branch and hypothesis, evidence needed or test, owner and due date, result, and whether the cause was verified along with the next action.
What a good fishbone diagram includes
- One measured effect at the head. “12 of 240 holes below 10.00 mm”, not “quality issues”. A vague head produces vague branches.
- A boundary. Where and when the effect happens, so the team does not chase causes from unrelated processes.
- Branches used as prompts. The 6Ms help people think wider; they are not boxes that must each be filled.
- Hypotheses, not conclusions. Each bone is a possible cause phrased so it can be tested (“reamer worn beyond limit”).
- A test and an owner for every hypothesis worth pursuing. This is where the register earns its page.
- An evidence reference. A measurement, trial or record that supports or excludes each cause.
How to run a fishbone session
- Bring together three to six people who know the process, including the operators who run it, plus someone from quality or engineering.
- Write the effect with its data at the head and agree the boundary before anyone suggests a cause.
- Work branch by branch, asking “what could cause this?” and adding sub-branches when one idea leads to another. Record every idea without debating it.
- Circle the hypotheses the data makes most likely, then move each into the register with a test, owner and due date.
- Run the tests and record the results. Follow a supported branch deeper with a 5 Whys worksheet before choosing a countermeasure.
Completed manufacturing example
An A3 canvas organises possible causes of undersize B42 holes under people, machine, method, material, measurement and environment. The verification register supports reamer wear, excludes gauge error and identifies the missing interval check as an escape cause.
Fishbone, Ishikawa and cause-and-effect diagram describe the same canvas here. Branches contain hypotheses until tested. Keep the measured effect specific and move each promising branch into an evidence-led investigation.
The effect is defined as 12 of 240 holes in lot L-260912 measuring below 10.00 mm, with a boundary running from reaming to final inspection. In the register, a new reamer removes the defect, so tool wear is verified and the next action is to validate a replacement limit. A reference gauge cross-check agrees with production gauges, so gauge error is excluded. A control plan review finds no in-process interval check, which explains why the defect escaped rather than why it occurred.
Common fishbone diagram mistakes
- Writing solutions on the bones. “Train operators” is an action, not a cause.
- Voting on the cause. The branch with the most sticky notes is not necessarily the right one; only a test can tell.
- Forcing all six branches. Leave a branch sparse if nothing credible belongs there.
- Blaming a person. “Operator error” usually hides a method, training or equipment cause worth finding.
- Stopping at the diagram. A finished canvas with no register entries has produced ideas, not an investigation.
Fishbone, Ishikawa or cause-and-effect diagram?
The three names describe the same tool, credited to Kaoru Ishikawa. The categories vary by industry; manufacturing teams usually start from the 6Ms shown on this template. A fishbone gives breadth, the 5 Whys gives depth, and a structured root cause analysis or 8D report carries containment, approvals and effectiveness checks when the problem reaches a customer.
When to use this template
Fishbone and Ishikawa refer to the same worksheet here. The canvas does not establish causality on its own.
Continue with 5 Whys worksheet, Root cause analysis, 8D report.
For shared records, evidence and follow-up, explore Bulk quality. Start a free trial to run it live, no card needed.
How to use it
- Print the canvas at A3 landscape, actual size. Write the measured effect at the head.
- Use the six branches as prompts, renaming them if needed. Add hypotheses, not conclusions; connect related ideas with short branches.
- Give each hypothesis a test, owner and evidence reference. Only the evidence register marks a cause verified.
Key features
- A3 cause-and-effect canvas
- Effect and investigation boundary
- Hypothesis verification register
Ideal for
- Teams investigating several possible causes of one defined defect
Common uses
- Running a cross-functional cause-and-effect workshop
Questions, answered.
01
What is a fishbone diagram used for?
A fishbone diagram lays out every plausible cause of one defined problem, grouped into branches, so a team can see the whole field before choosing what to test. It is a structured brainstorm, not proof of the cause.
02
What are the 6Ms of a fishbone diagram?
People (often written as Man or Manpower), Machine, Method, Material, Measurement and Environment (sometimes Mother Nature). The template uses these six as prompts, and you can rename a branch when another category fits your process better.
03
Is a fishbone diagram the same as an Ishikawa diagram?
Yes. Fishbone, Ishikawa and cause-and-effect diagram are three names for the same tool. It is named after Kaoru Ishikawa, and the fishbone name comes from its shape.
04
What size should I print the fishbone template?
The canvas is laid out for A3 landscape. Print it at actual size so a team has room to write on the branches; the verification register prints on its own A4 landscape page.
05
Should I use a fishbone diagram or the 5 Whys?
Use the fishbone when several cause families are possible and you need breadth. Use the 5 Whys worksheet to follow one supported branch down to a cause you can act on. Many investigations use both.
Related templates.
5 Whys worksheetBuild an evidence-led causal chain. Stop when the cause is verified, not when a box is full.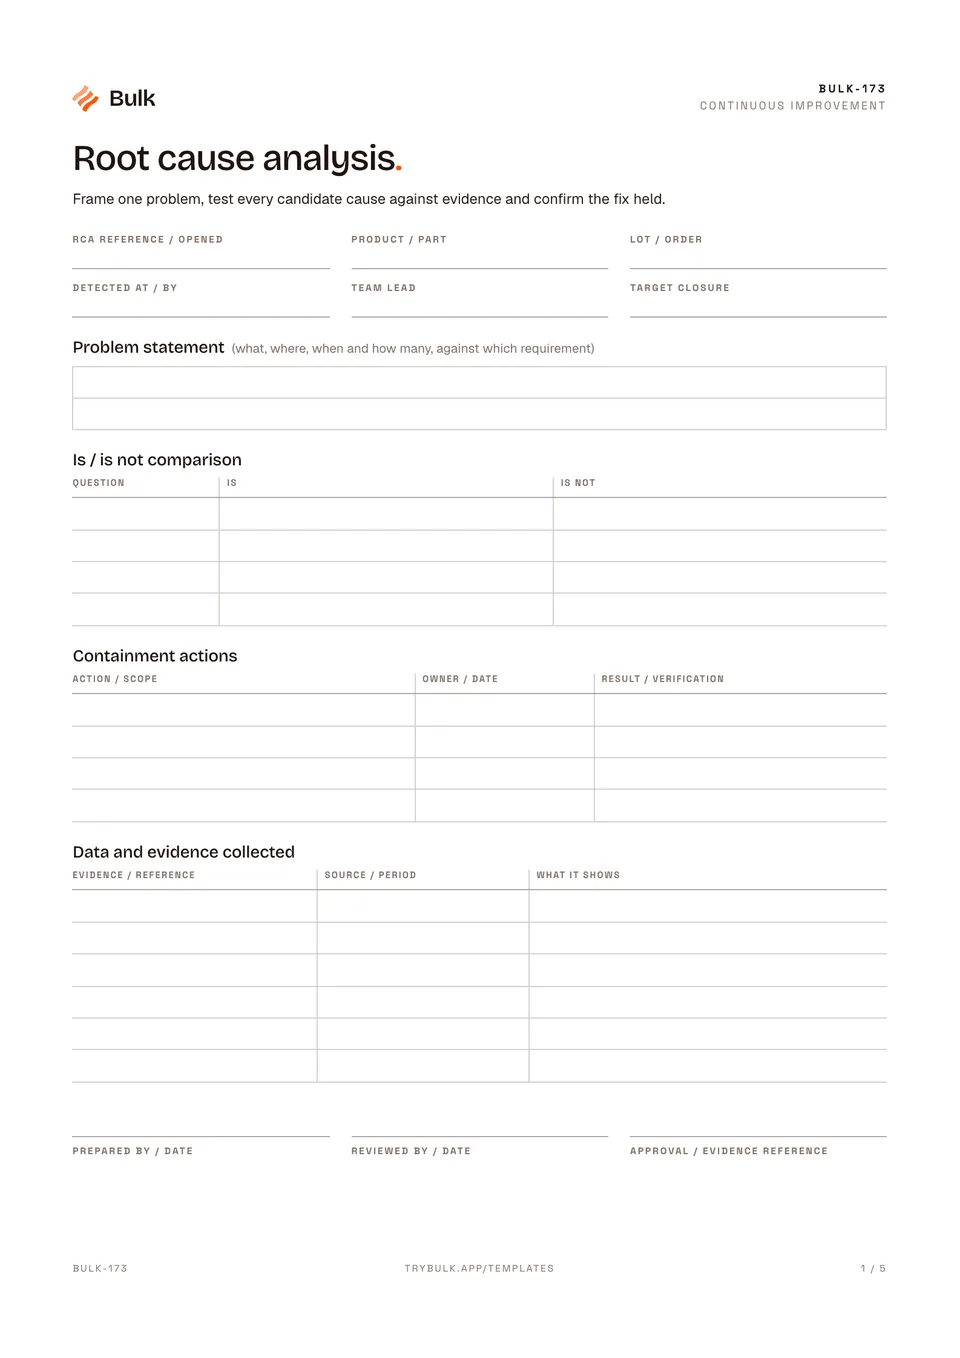 Root cause analysisFrame one problem, test every candidate cause against evidence and confirm the fix held.
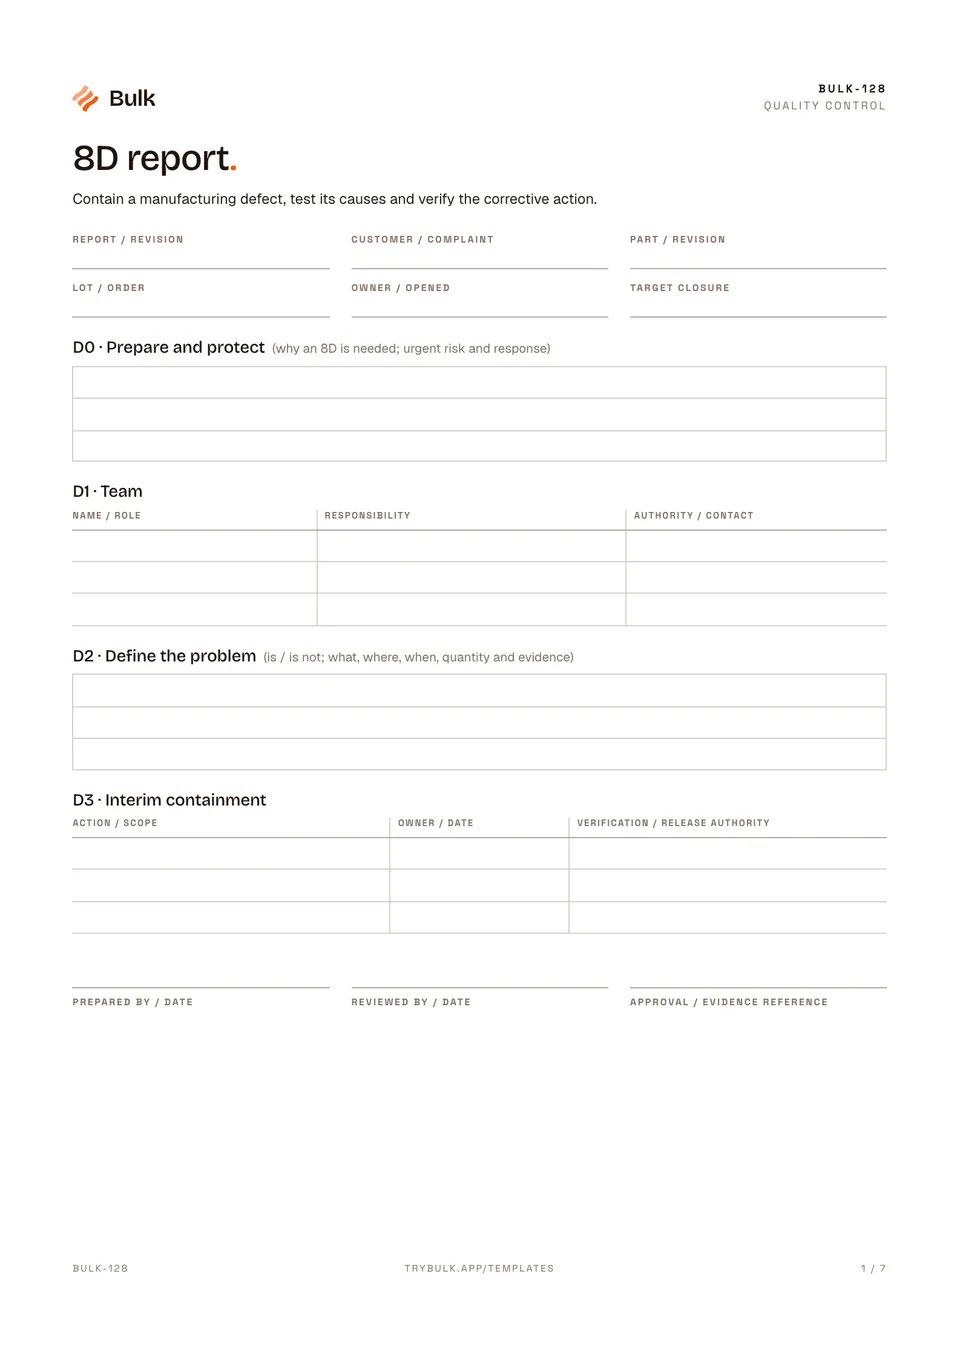 8D reportContain a manufacturing defect, test its causes and verify the corrective action.
Turn the form into a live workflow.
Bulk connects the same checks, evidence, owners and approvals to the work happening on your floor.